

Analyze
In this section, you are able to analyze your trigger link activity. When you use trigger links, the main goal is to perform automation after the click. But in order to fully understand if a link is successful, you need to analyze the clicks and activity around it!
NOTE: Depending on your user permissions, you may not have access to all of the components.
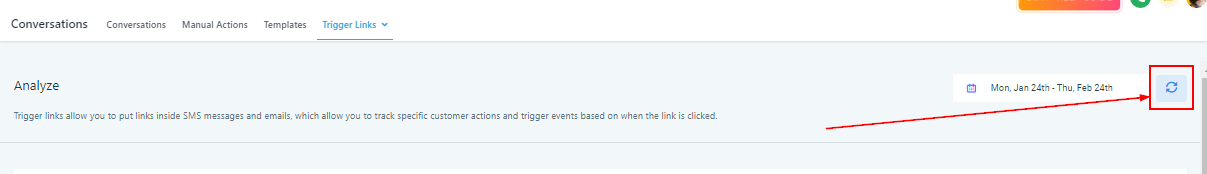
You can select a specific date or date range, you want to use when analyzing your trigger links.
.png?alt=media)
In order to get the most up-to-date information in the charts below, you might need to use this button to refresh the data.
On the far left side of the bar chart, you will see the click axis. The numbers on this access will vary depending on your highest clicked trigger link for the selected date range.
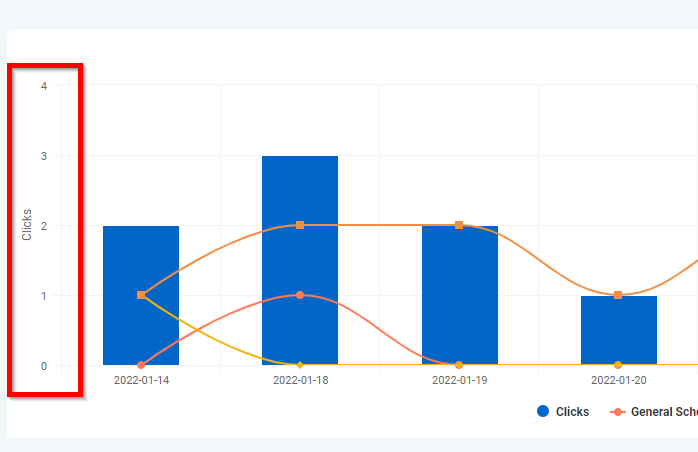
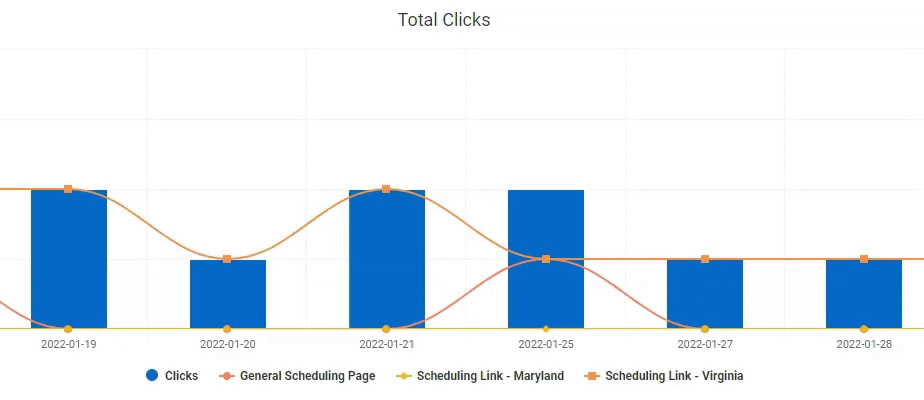
When you are analyzing trigger links, multiple links will show up on the bar chart as different colored shapes.

When you hover over each bar, you will see the different trigger links and the total clicks on that trigger link for that specific date or date range.
In this column of the data table, you will see your trigger links listed by name. You can sort this list alphabetically.

In this column of the data table, you will see the total amount of clicks that your trigger link received during the selected date or date range. You can sort this list by total clicks.

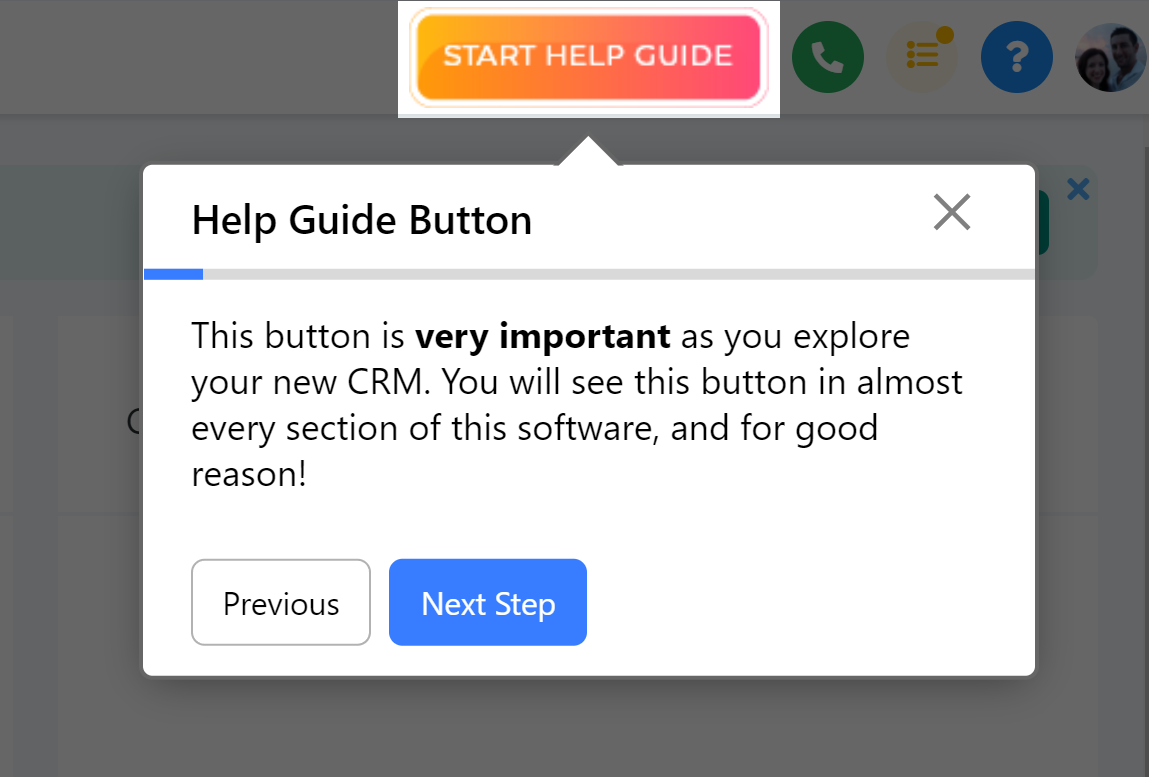
Click the "Start Help Guide" button in this section of your CRM to start an interactive, guided tour and learn more about the components found in this section and how to use them!
Last modified 9h ago